


A visual approach to explain a complex energy pricing system
Case Story – Ministry of Energy / SEC
Context
The “Winter Limit” is a regulatory mechanism in Chile’s energy system that directly impacts household electricity consumption and cost. However, it is typically communicated through technical language and complex rules, making it difficult for citizens to understand how it affects their daily lives.
How the System Works
The Winter Limit is calculated using:
- the average electricity consumption during summer months
- plus an additional 20% margin
This value is then compared to a minimum threshold (350 kWh), and the highest value becomes the user’s limit.
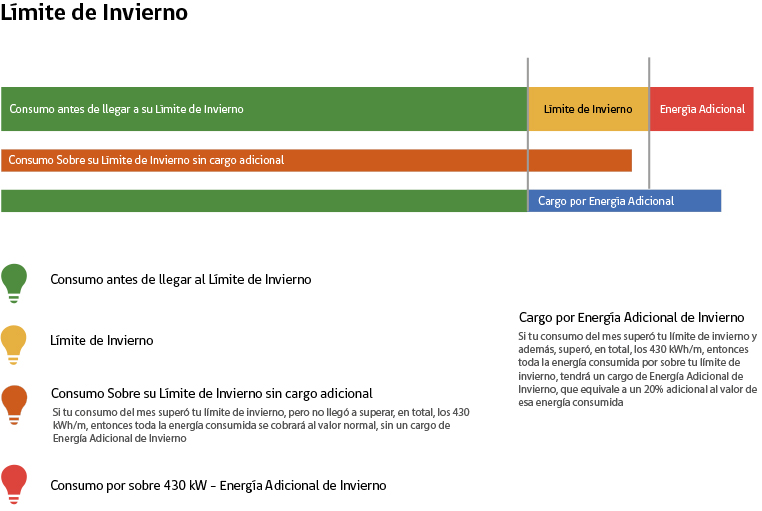
If consumption exceeds this limit during winter:
an additional charge is applied to the excess energy used
In some cases, the charge is triggered only if consumption surpasses a higher threshold (around 430 kWh)
Challenge
The challenge was to translate a highly technical regulatory concept into a clear and intuitive explanation for non-expert users, without losing accuracy.
At the time, available information was fragmented, technical, and not designed for public understanding.
How to explain a technical pricing system in a way that:
- is intuitive
- shows cause and effect
- helps people understand their consumption
Design Thinking approach
The process began by reframing the problem from a human perspective:
What does this mean for people in their everyday lives?
Initial explorations included linear explanations (timelines), but these failed to communicate how the system actually behaves.
At first, I explored explaining it as a timeline.
This led to a deeper exploration focused on how people naturally understand limits, thresholds, and consequences.
Science communication principle
The key insight was identifying a familiar mental model:
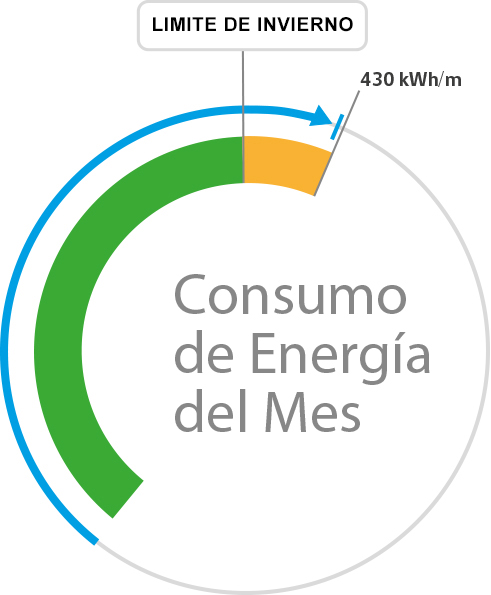
The system behaves like a tachometer or pressure regulator
There is a threshold, and once it is exceeded, the system responds differently.
By mapping the regulation to this familiar concepts:
- Abstract rules became predictable.
- Invisible thresholds became visible
- Complex behavior became intuitive.
This approach applies a core principle of science communication:
People understand complex systems better when they are linked to familiar experiences.

suddenly, the system became intuitive
Solution
The system was translated into a visual model that:
- represents consumption as a measurable level
- clearly defines the threshold
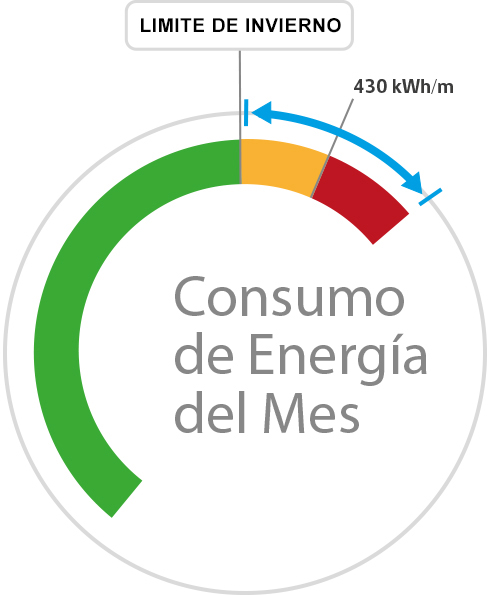
- shows what happens when the limit is exceeded
- connects behavior with consequence
Impact
The system was translated into a visual model that:
-
- represents consumption as a measurable level
- clearly defines the threshold
- shows what happens when the limit is exceeded
- connects behavior with consequence
Understanding begins when complexity becomes intuitive